So, we’re three weeks into another joyous fantasy basketball season. The hot waiver pick-ups are gone or have fizzled out. Hope you got the ones with lasting value. Pretty soon, the sample sizes will be large enough to know that what we’re seeing is more or less legit. For now, there’s still a lot of regressing to the mean yet to come. Hot and slow starts will mostly fade away, and the players will be themselves over the long haul. Not everyone, as plenty of players take significant leaps or stumbles for the entire season, whether it has to do with a change of scenery, personnel, and/or usage. It can be tough to figure out whose rebounds and steals changes, for example, will stick. However, we can trust with a good amount of confidence that most players shooting percentages will end up relatively close to their previous numbers. And, this early in the season, when, say, Serge Ibaka goes 15-for-17 and then 8-for-8, percentages can be way out of line and skew value if you’re looking at rankings in a trade scenario.
I did a little project this week to help identify which players will soon be moving up or down in the rankings, if only due to the regression of their percentages. Remember that regression works in both directions. A few other points to keep in mind: As I discussed in-depth last week, we really need to keep shooting volume in mind when reading percentages, but the percentage itself is the predictable statistic. Also, remember that, just because a player is 15% under his expected mark, it doesn’t mean you should expect him to shoot 15% over it so that he ends the season at the career mark. We still expect the career mark to happen from this point on. As an example, after a coin comes up heads three times in a row, it doesn’t suddenly have a better chance to come up tails the next time to even it out. The probability remains 50/50 there. Now, these are humans and not coins, so there’s a chance that there’s a reason someone is doing worse or better than usual beyond variance and random chance. Maybe there is some sustainability to a handful of these changes in percentages. Just don’t expect them to sustain the big changes I’m going to show you today. To illustrate the point, I’m fairly certain that DeAndre Jordan won’t increase his Free Throw Percentage by 25% for the whole season, but it’s not crazy to expect 10%.
What you’re going to see here are many of the relevant players whose Three Point, Field Goal, and Free Throw Percentages are the most different (through 11/5) compared to last season. This means I’m leaving out rookies, but for many of them, you can check on their college/international numbers and compare should you desire. You may want to use career numbers rather than just last season’s stats (which I’m using) to potentially give you a better baseline, too. Use these lists below to identify some sell high and buy low players, if you like. And just keep this concept in mind as you receive trade offers. Don’t just go by in-season rankings. There’s a lot of significant correction yet to come for many fantasy starters.
Three Point Percentage
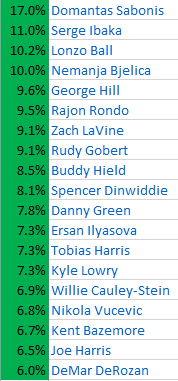
Due for a DROP in value (shooting at least 10% better than last season)
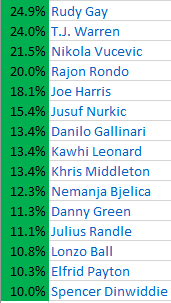
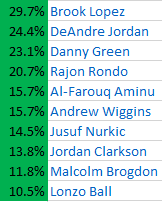
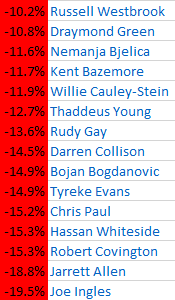
Due for a RISE in value (shooting at least 10% worse than last season)
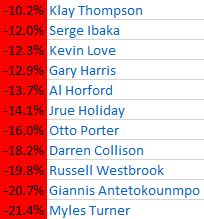
Field Goal Percentage
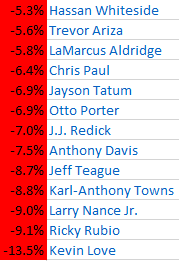
Free Throw Percentage
This week’s classic fantasy line:
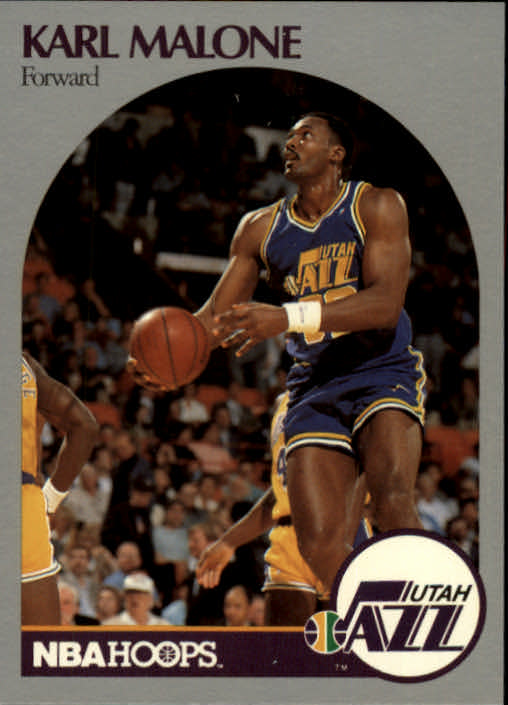
Let’s give some love to the Mailman. Karl Malone, the NBA’s second leading scorer of all-time had quite a season in 89-90. I think have that card somewhere, too.
![]()