I used to play a lot of fighting video games. Street Fighter 2, Mortal Kombat, and the like. I think I aged out around the time they were up to Ultimate Mortal Kombat 3 and Super Street Fighter 2 Championship of Everything Ever Edition Turbo. But I know they kept going, adding more characters, merging games. And that’s sort of what I wanted to do this week. I’ve written a decent amount about stuff like category specialists, how scarce the stats in each category are, how volume skews percentage stats, and just how detrimental the percentage and turnover performances of your players can be. Well, today, we’re going to witness a 2018 battle royale of sorts. Using Basketball Monster, I took the standard deviation value of each individual’s statistical performance in each category, and ranked them. Other sites have slightly different values due mostly to alternate assumptions and weights. There are some writers out there who have explained fantasy basketball standard deviation values in depth and in ways that are much more exciting than those in my old college statistics books. So, if you’re really curious, you can find out more with a little searching. I’ll just say that, in general, a standard deviation score of 2 means that the performance is roughly better than almost 98% of the rest of the league. A score of 3 is about where you’d expect the best performance in the league to be, as it’s usually around the 99.9th percentile. Same thing for negative values, just reversed. So, if you see a value exceeding 3, and I’ve shared some of those insane standard deviation scores from the last few decades in previous posts, it’s super-valuable (turbo edition 64?). Some categories don’t have anyone reaching 2 or -2, meaning the numbers are more bunched up together. But some have some extreme outliers. That’s what we’re looking for today.
Boban’s gotta be in there somewhere, right?
I present to you the most and least valuable individual category performances of the year (per-game through 12/4, with some small sample players removed).
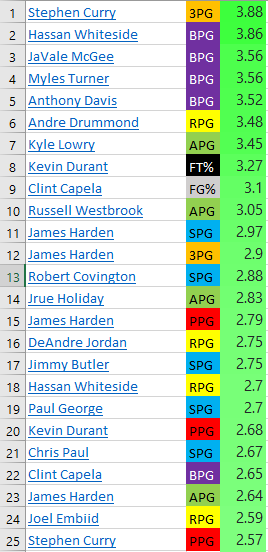
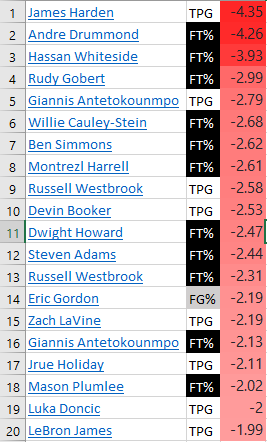
Obviously, we care about the whole stat profile of a player, but I think it’s helpful to compare the value of different stat categories for some of the most valuable fantasy players. Category scarcity is easier to see this way, too. For example, DeAndre Jordan’s 13.6 rebounds per game are just about as valuable as Jimmy Butler’s 2.1 steals per game. And those stats help you about as much as Giannis’ 4.4 turnovers per game hurts you.
Also, just something I heard on a podcast lately: Klay Thompson’s making the same amount of threes per game as he did five years ago (2.7), but his standard deviation value there went from 1.99 that season to 1.38 this year. So many more threes league-wide now, of course. Just a reminder that even the same stat set can change value from season to season.
Anyway, have fun with this. This season, match up your Kevin Durant’s FT% against your buddy’s Kyle Lowry’s assists per game like it’s M. Bison vs. Goro!
This week’s classic fantasy line:
Let’s go with one of the most extreme, yet great stat lines from last season. Andre Drummond improved his FT% quite a bit, so he wasn’t as much of an anchor there. And in the other direction, Drummond had some huge positive value stats, including the most valuable production in any category in the league (his 16.0 rebounds). See the standard deviation values (per Basketball Monster) below the stats.