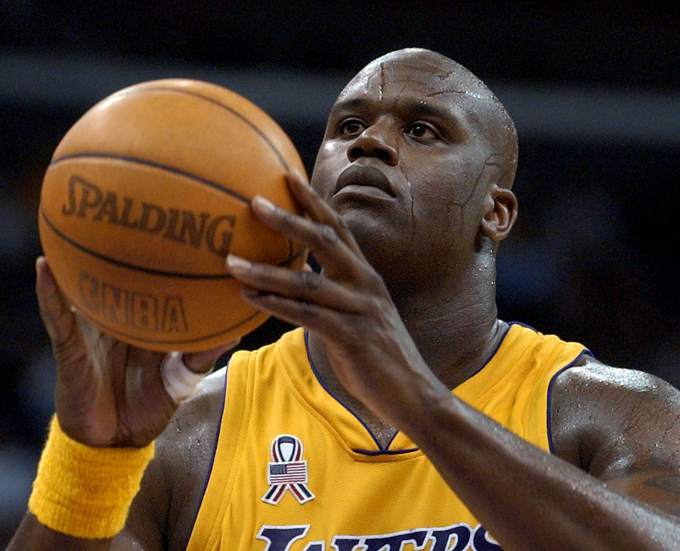
It’s the summer of 2000. Who wouldn’t want to draft Shaquille O’Neal, fresh off a MVP season, in the 2nd round of a fantasy draft? Sure, his free throw percentage was terrible, but you could make up for that with a couple FT% specialists, right? Plus, Shaq still finished as the 15th most valuable player for that MVP season despite the horrendous 52.4% from the line (9-category per-game rankings according to Basketball Monster). He’d go on to, more or less, repeat his 29/13 with 3 blocks and the most dominant field goal percentage in the league (more than twice as valuable in that category as anyone else). The FT% took a slight dip to 51.3%, but this was the height of “Hack-a-Shaq”, and his free throw attempts increased from about 10 to around 13 per game. He fell all the way to the 39th ranked player. And what’s worse, his FT% negated nearly all of his positive contributions.
Last week, I discussed some of the unheralded stats: Threes, Steals, and Blocks. At this point, many experienced fantasy b-ballers know to pay a good amount of attention to those, though. Today, I’ve got three more categories to ponder that may get ignored just as much. However, these three can also hurt your team as opposed to, at worst, adding zero stats in a category (yes, a zero in a category can be a negative to your team, but I’m talking stats that can get far more negative than the best players’ positive value in the category). Today’s categories are Field Goal Percentage, Free Throw Percentage, and Turnovers. The reason I bring these up is to get you focused on these stats as much as you are on the popular ones like points, rebounds, and assists. They count for just as much, and since your competition likely doesn’t value them as much, you can get an advantage in your league.
We’ll get back to Shaquille and his efficiency categories, with his best-in-the-league FG% and worst-in-the-league FT% in a moment. But, let’s start with:
Turnovers:
Again, back to a recent research project in which I figured out the average stats among fantasy starters in typical leagues.
Overall, the average was 1.9 turnovers.
Broken down by position, the averages are as follows.
Point Guard: 2.4
Shooting Guard: 1.9
Small Forward: 1.7
Power Forward: 1.9
Center: 1.7
That’s less difference between positions than I’d have guessed. Since, we really don’t need to differentiate much by position, the only points to consider, in my opinion, are that (1) point guards average a decent amount more TOs and (2) most of the worst offenders are located within the top 30 or 40 players. So, it’s okay to employ worse-than-average turnover guys in those spots. Now, what’s a significantly harmful amount of turnovers? Well, 3.0 TOs per game is approximately as much of a negative as the value you get from the players with the least amount of turnovers is a positive. Those are the handful of guys that average under 1.0 TO. However, there are 20+ players that exceed 3.0, and as you get closer to and exceed 4.0, you obviously need two or three of the low-turnover all-stars to even it out. I really think that you could make a trade for two players that are comparable, even nearly identical, in all eight other categories with you getting a 1.0 turnover guy for a 3.0 turnover guy, since I think many people don’t even give TOs a second thought.
***Favorite turnover ever.
Field Goal Percentage/Free Throw Percentage:
I’m going to lump these two together, because the concept is the same. We can get an advantage here over all the fantasy managers that only look at the percentages while we’re adding another dimension: volume. I know it’s hard to avoid just going by your players’ percentages when you’re looking at your team page, for example, but you’re so much better off if you factor in the volume of their attempts. And you’re even better off if you go directly to the values you find in some sort of player rater (ESPN Player Rater, Yahoo “std dev” values, etc.) as they have volume factored in already.
A few practical examples:
Last year, 79% was about the mid-point FT%. Kyle Korver has always been one of the best free throw shooters in the league. Last year, he hit 89% from the stripe. However, he did so on only 1.0 attempt per game. His impact on your FT% (approximately, as all teams have different numbers of total attempts, though it’s not worth worrying about) was only about as helpful as Josh Richardson’s 84.5% on 1.8 attempts or Kawhi Leonard’s 81.6% on 4.2. Volume makes a huge difference.
So, how bad are the high-volume bad-FG% and bad-FT% players for our teams?
Back to Shaq’s jaw-dropping FT% anchor. In that 2000-01 season, a score of 0 on the Basketball Monster player rater was equal to about 77%. So, in order to get back to zero and wipe out Shaq’s massively negative contribution in the category, you’d have to draft roughly the top six players in positive free throw contribution. This, if it was possible, would have you slightly above the NBA average, which still might be below average in your fantasy league.
Yes, the worst FT% players these days aren’t exactly that terrible, but here’s an illustration. Last year’s biggest negataive at FT% was Dwight Howard. His 57.4% on 7.2 attempts was as bad as the two best FT% contributors combined. And you likely didn’t have both James Harden and Damian Lillard on your team to cancel out Dwight. Most likely, you would’ve had to take the top FT% player available in each of the first three rounds of your draft to offset him. Another way to picture just how much Dwight’s free throws hurt last year: It would be approximately as bad as a player averaging negative 8.0 rebounds. Seriously.
This leads to an obvious solution for the seasoned fantasy veteran. If you’re considering one of the worst of the worst FT% dudes, you’ve got to punt the category (definitely in roto leagues, almost definitely in head-to-head, depending on how bad the FT% and volume are), or you’re just playing catch-up with the remainder of your roster while it just sucks all the value out of those players and causes you to pass up better options. More likely, it’s the other way around, and you’re planning on punting FT%, and that leads you to scooping up a bunch of these bricklayers. And then, of course, you draft DeAndre Jordan, who’s shooting 82% from the line, as we all completely expected!
FG% (average around 47%) didn’t have quite the extreme negatives last year that FT% traditionally has. The year prior, Russell Westbrook had spectacularly torpedoed your efficiency from the field with his 42.5% on 24 attempts. Last year, Lonzo Ball was quite a drain with his 36% on 10.8 attempts, but that could be balanced out by somethings like an extra center that shoots near 60%. So, you don’t have to be quite as afraid in the FG% column. Just remember that volume aspect, and you can get the upper hand in trades and pickups.
This week’s classic fantasy line:
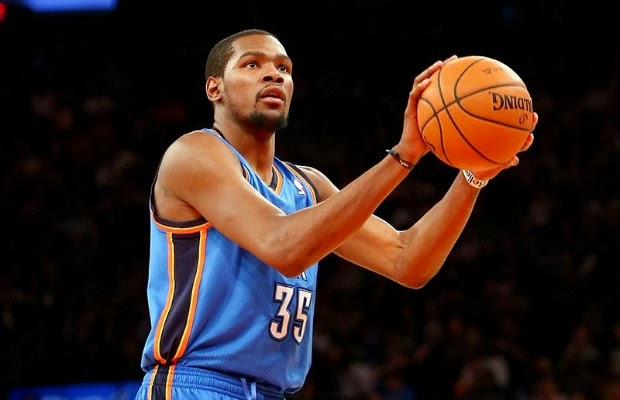
Kevin Durant finished the season on top of the 9-category per-game fantasy rankings in 2010, 2011, 2013, 2014, and 2017. In celebration of dominant FG% and FT%, I feel we should recognize Kevin Durant’s 2012-2013 season, where his high-volume FT% was the most valuable fantasy stat per game that year (slightly ahead of Serge Ibaka’s blocks, per Basketball Monster). This was his 50/40/90 season (FG%/3P%/FT%). One of 11 in history accomplished by just seven players.