
Well, opening night got off to a face-punching, limb-snapping start, and I’m currently watching the stats roll in from eight games at once on night two! It’s so good to have the NBA back.
Let’s get to the numbers. What if I told you that you could be Biff Tannen? Nah, crashed his convertible into a manure truck. More than once. Maybe this: What if I told you that you could have access to every sporting result alllll the way up until the year 2000??? Dang it. This analogy would’ve worked a lot better 30 years ago. Anyway, today, I’m going to hand you the 2018 Sports Almanac. The NBA section, at least. Straight out of a flying Delorean. And I’m going to try to keep it short today, because I’m including some extra credit homework for you overachievers.
Those of you that play the other big fantasy sports know that basketball stats are more predictable than baseball stats and far more predictable than football stats. This is one of the many reasons I greatly prefer fantasy basketball. Less random luck = more skill required to win. Not that the NBA doesn’t surprise us on a regular basis. It just has a much larger sample size for each game and for each season. In an NBA game, a player might touch the ball 100 times, defend the ball 100 times, take 15 or 20 shots. Seems like that’s about the same amount of opportunities an MLB player might have in a month or an NFL player in an entire season. With a giant sample size, the stats are bound to come out much closer to what we expect over the course of a season (unless there’s some significant change in minutes, usage, injury status, etc.). If you look at a player’s stats by season, they generally don’t have large swings from one year to the next. The benefit of all this is that we can project how our fantasy league will pan out, and it shouldn’t be all that far off from reality. Sure, those variables I mentioned will shake it up, as will your pick ups and trades. But, I find it extremely helpful to not only look at my own team to see where I think I’m strong and where I’m weak, but to project the entire league, since each league is different. This can truly show you the categories where you’re in contention, leading by so much that you can trade off some surplus stats, or trailing so far behind that you might as well punt. This is mainly for Roto leaguers, since the actual total season stats will matter, but H2H players can definitely benefit from this, too. You’d be able to match up your projections against your opponent, though there’s a lot more weekly player movement to alter that, as well as it being a smaller and less predictable sample.
Here’s how we take advantage of this semi-predictability. I know some sites project the league results in real-time during the draft, and maybe afterward, but I find that I wouldn’t likely be starting the same players the sites are putting in there for their projections. Also, I really don’t agree with the projections from the sites I use (Yahoo and ESPN) all that much. I recommend using a set of projections you trust, that’s been thoughtfully put together by a human with a brain and the ability to read news rather than a computer algorithm that seems to only know what happened last season. You’ve got two sets of those trustworthy projections right here on Razzball.
Here’s what I recommend. Use Excel. Paste in all the projected stats from the set of your choosing. It may be as simple as pasting from your team page if you’re going with what your site provides. Add ’em up, and you’ve got a reasonable prediction as to how your team, and eventually, your league, will shake out. Nervous about Excel? You can do it. Start by putting all the players you think your team will start on a tab along with their numbers. As an example, here’s part of my pride and joy. My favorite team. It’s in a long-term dynasty league where we keep 18 players (out of 25). I’m rebuilding on the fly, and I’m a free throw punter that just got rid of Drummond, so I’m interested to see how my transitioning team stacks up this season. We start 13, but I make sure to max out my games played (always make sure you’re getting every edge you can), so I’m going to need extra players to make up for the games those 13 players miss. I’m using Basketball Monster projections again, and Josh Lloyd, the Aussie podcaster that does these projections gives a games played estimate for each player. I’ve adjusted many of them down to 75 or lower to be conservative and to fit my total into 1066 games (82 games * 13 roster spots). If you like, go ahead and change some projections, maybe for rookies that you probably won’t start until the final months, since their lower-minute early months are likely factored into their projections. Make this your own.
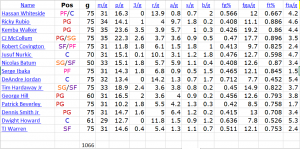
From here, I use simple formulas to change these per-game stats into season total stats by having Excel multiply them by the games played. Then, I use the sum formula to get my totals. If that sounds scary, know that you can Google how to do just about anything in Excel and learn it very quickly. YouTube, too. Really, you can do this.
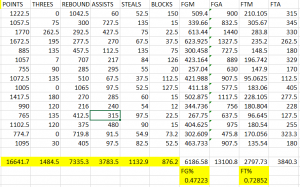
So, the yellow boxes are my expected results in each of my league’s 8 categories. Once I do it for the rest of the teams in the league, I’ve got a full standings page I can use to see how I’m measuring up. If you do this, maybe you notice that you stand to gain three points in steals if you can just increase your total by 60. And maybe you’re out in front in rebounds by 250. Well, that’ll show you what trades to go after. Remember what I talked about in the prior weeks. Each player has a different value to each team. Maybe you’re locked into first or last in FG%, so you ignore that category and end up benefiting greatly by trading the 55th ranked player for the 82nd ranked player. And, because of that discrepancy, you should be able to get something else to even it out. Also, if you have these projections this accurate, you can even try to go next level and discover which player to trade to a team out of contention so that they can pass your rival in assists. Stuff like that. You want to be the first to recognize these advantages so they can have a greater impact by making the moves earlier in the season. I can’t stress enough how much it can help to have more data at your finger tips than anyone else. What’s a better way to say it? I know, Chris Farley’s character from the underrated 1998 film Dirty Work can paint the picture better:

“They say in the land of the blind, the man with one eye is king. Well in the land of the skunk the man with half a nose is king!”
…I promise I’ll work on my analogies.
This week’s classic fantasy line:
13-13 FGs, 9-9 Threes, 2-2 FTs for 37 points. Klay Thompson’s record 3rd QUARTER (January 23, 2015).